
A good rental property analysis spreadsheet is an investor’s best friend. It’s the tool that lets you systematically break down the income, expenses, and potential returns of a property before you even think about making an offer. This isn’t about just plugging numbers into a simple online calculator; it’s about building a financial model that reflects the unique details of the Dallas market. It’s what separates a hopeful guess from a solid, data-driven investment decision.

Why Generic Calculators Fail Dallas Investors
Using a generic online rental calculator for a Dallas investment is like trying to navigate the Dallas North Tollway during rush hour with a map of the United States—it’s just not specific enough to be helpful. These one-size-fits-all tools often mislead investors by plugging in national averages that simply don’t apply to the complex and highly localized financial reality of the DFW metroplex.
A custom-built rental property analysis spreadsheet forces you to get your hands dirty and dig into the details that truly drive profitability in North Texas. This isn’t just a number-crunching exercise. It’s about creating a financial story that understands the vast difference between buying a historic duplex in the Bishop Arts District and a brand-new townhome in Plano.
The Problem with Broad Assumptions
Generic calculators are built on dangerous assumptions that can completely wreck your projections. They might pull a national average for property insurance, totally missing the fact that Texas premiums are higher because of weather risks like hail. Even worse, they can’t account for the massive differences in property tax rates from one DFW city or county to the next.
The effective property tax rate in Dallas County can climb over 2.5%, which is among the highest in the entire country. A generic calculator using a 1.25% national average would understate your single largest expense by thousands of dollars a year. An investment that looked great on paper could instantly become a money pit.
Capturing Dallas-Specific Nuances
This is where building your own spreadsheet gives you a serious edge. It empowers you to input variables that reflect what’s actually happening on the ground in specific Dallas neighborhoods. This granular, detailed approach is how savvy investors find their winning deals.
With a custom analysis, you can account for the real costs:
- Hyper-Local Tax Rates: You’re not guessing. You can input the precise combined tax rates for Dallas ISD, Collin County, or Tarrant County, which all vary significantly.
- Neighborhood Maintenance Costs: You know the upkeep for an older home in the M Streets with a pier and beam foundation is going to be different from a slab foundation home in a suburb like Frisco.
- Realistic Insurance Premiums: Instead of a vague estimate, you can get actual quotes for Dallas properties and plug them right in.
- HOA Dues: Many of the newer developments in areas like Richardson or Las Colinas have mandatory HOA fees that generic tools almost always ignore.
At the end of the day, a custom spreadsheet is more than just a calculator; it’s your strategic playbook. It ensures your decisions are built on the hard data of the Dallas market, not the convenient but misleading fiction of a generic online tool. This hands-on analysis is your first real step toward making a confident and genuinely profitable investment in DFW real estate.
Building Your Dallas Property Analysis Template
Creating your own rental property analysis spreadsheet is the first real step toward making smart, data-driven investment decisions in the Dallas market. This isn’t just some document; it’s your blueprint for sizing up any potential deal, whether it’s a single-occupant rental in Frisco or a duplex over in East Dallas. The trick is to build a clean, reusable, and well-organized template from the very beginning.
I recommend setting up your spreadsheet with three distinct tabs: Property Inputs, Cash Flow Projections, and a Metrics Summary. Separating them like this keeps everything tidy and makes your analysis flow in a logical way. Your ‘Property Inputs’ tab is the foundation—it’s where you’ll plug in all the core data for a specific DFW property.
The image below gives you a clear picture of how your spreadsheet will take these inputs and turn them into insights you can actually use.
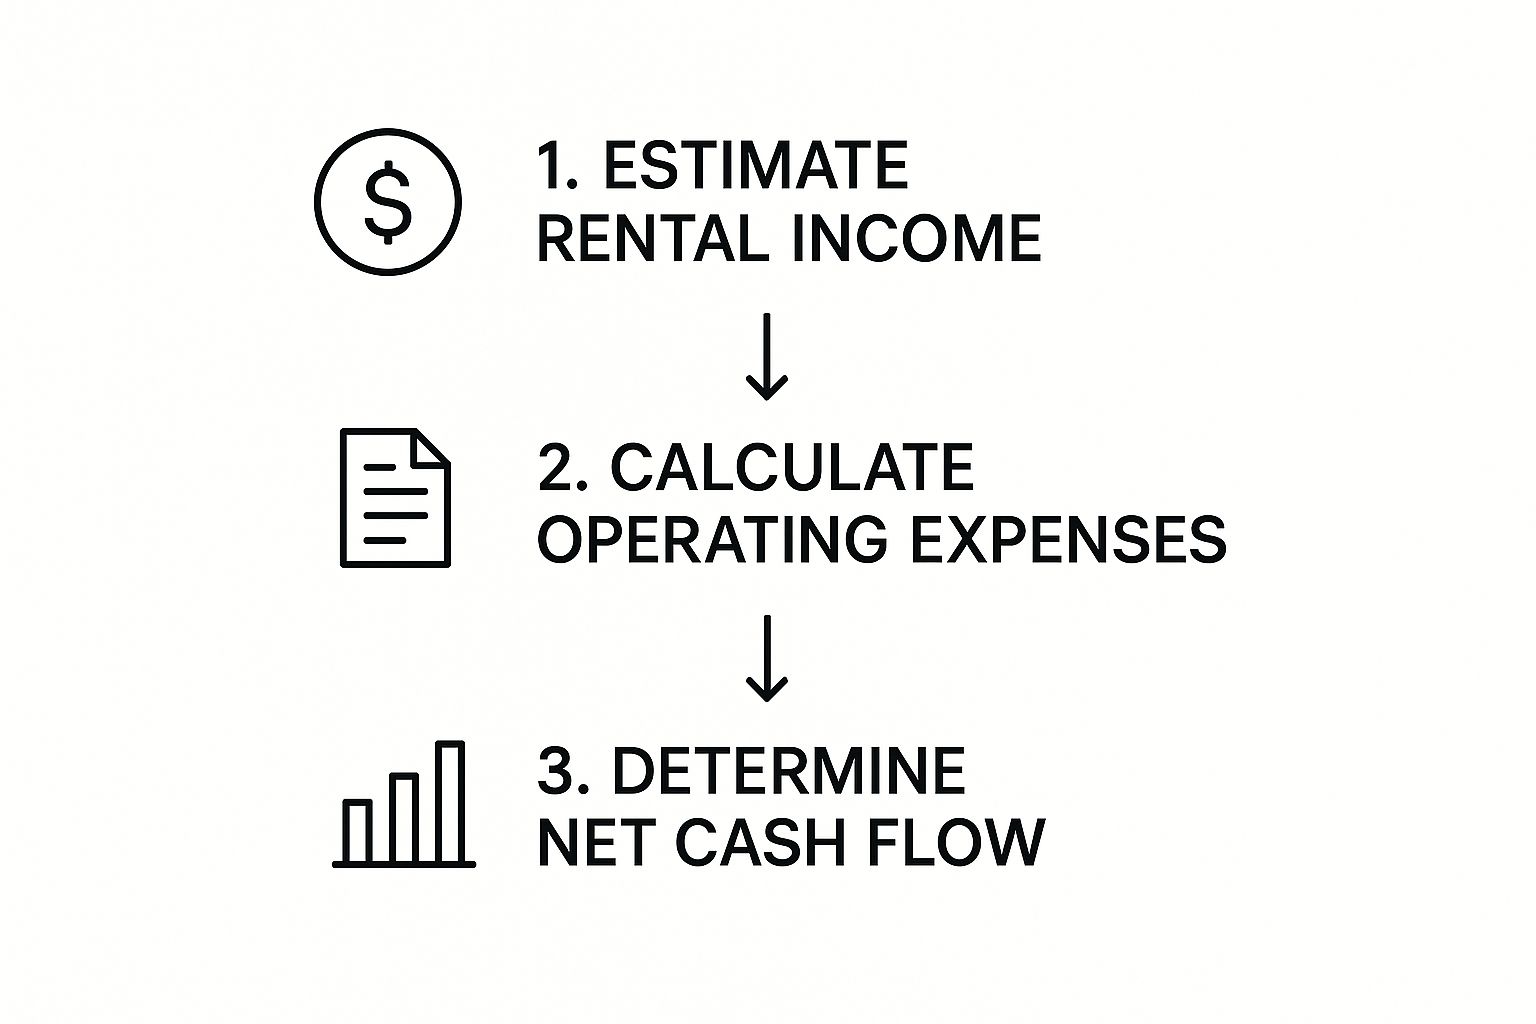
As you can see, you can’t get to an accurate cash flow number without first doing the hard work of gathering all your local income and expense data.
Structuring Your Property Inputs Tab
This first tab is where you’ll capture all the initial data for a potential investment. Think of it as the property’s “fact sheet.” Every other calculation in your spreadsheet will pull from this tab, so getting the numbers right here is absolutely critical.
To get a complete picture of a property’s potential, you need to gather specific pieces of information. The table below outlines the essential data points you’ll want to include in your spreadsheet for any Dallas-area property you’re analyzing.
Essential Data for Your Dallas Property Spreadsheet
A checklist of the critical data points you must gather for each potential Dallas investment property to ensure an accurate financial analysis.
| Data Point | Description | Dallas-Specific Example |
|---|---|---|
| Purchase Details | Asking price, your target price, and estimated closing costs. | Closing costs typically run 1-2% of the purchase price for a buyer in Dallas County. |
| Financing Info | Your down payment, total loan amount, interest rate, and loan term (e.g., 30 years). | A 25% down payment on a $350,000 property with a 6.8% interest rate on a 30-year fixed loan. |
| Rehab Budget | An itemized budget for any planned renovations. Get quotes whenever possible. | $15,000 for new flooring, kitchen updates, and interior paint for an older home in Richardson. |
| Property Specifics | Address, year built, and square footage. Vital for comparing properties and comps. | 123 Main St, Plano, TX 75023; built 1998; 1,850 sq. ft. |
| Rental Income | The projected monthly rent based on comparable local rentals (comps). | Comps for a 3-bed/2-bath in the area suggest a market rent of $2,400/month. |
| Operating Expenses | Includes property taxes, insurance, HOA fees, vacancy rate, and maintenance budget. | Dallas property taxes (~2.2%), homeowners insurance quote, $50/mo HOA, 5% vacancy, 8% maintenance. |
Having these details laid out clearly for every property makes side-by-side comparisons much more effective and keeps your analysis grounded in reality.
For a truly robust analysis of the Dallas market, you’ll want to pull the most current data. Exploring strategies for scraping real estate listings can be a powerful way to gather comps and rental info automatically.
Organizing for Scalability
The whole point is to build a master template that you can quickly copy and paste for each new deal you find. A well-structured ‘Property Inputs’ tab saves you from reinventing the wheel every single time.
A classic rookie mistake is mixing your inputs (the raw data) and your calculations (the formulas) on the same sheet. By keeping all your raw data on one dedicated tab, you can easily tweak a single number—like the purchase price or an insurance quote—and watch the entire analysis update automatically without breaking any formulas.
This disciplined approach not only saves a ton of time but also drastically cuts down on the risk of errors. For investors trying to build a portfolio in competitive DFW neighborhoods, that kind of efficiency is a huge leg up.
To get a better handle on the local market dynamics, dive into this comprehensive Dallas real estate investment guide for more expert insights. Think of this spreadsheet as your first step to putting those strategies into action with real precision.
Forecasting Income and Expenses in DFW

This is where the rubber meets the road. The financial engine of your rental property analysis spreadsheet is built on accurate projections. Get this part wrong, and even a small error can ripple through every calculation, turning what looked like a slam-dunk deal into a financial nightmare.
To really get a feel for a Dallas property’s potential, you have to dig in and meticulously forecast both its income streams and its specific, local expenses. It all starts with the Gross Scheduled Income (GSI)—that’s the total potential rent you’d collect in a year if the property was occupied 100% of the time. You can’t just pull this number out of thin air; you need solid rent “comps” for that specific neighborhood. After all, the rent for a townhome in Irving is going to be wildly different from a single-occupant rental in Richardson.
Grounding Your Income Projections in Reality
Never, ever guess the rent. The integrity of your entire spreadsheet hinges on using real-world data from the specific DFW submarket you’re targeting.
From there, you have to factor in a realistic vacancy rate. It’s a hard truth, but no property stays rented forever. In the competitive Dallas market, I always advise clients to build in a conservative vacancy rate of 5% to 8% of the GSI as a buffer. For a brand-new property in a hot area like Lower Greenville, you might feel comfortable closer to 5%. But for an older property in a less sought-after spot, bumping that to 8% gives you a much more realistic safety net against those inevitable income gaps.
While it’s good to know what’s happening on a larger scale—for instance, these global rental market trends and their drivers—those numbers don’t mean much on the ground here. Local DFW dynamics tell a completely different story.
Deconstructing Your DFW Operating Expenses
On the other side of your spreadsheet are the operating expenses. These are all the ongoing costs needed to keep the lights on and the property running smoothly, and they fall into two main buckets: fixed and variable.
Fixed Expenses are the predictable, consistent costs you can count on every month or year. These are your non-negotiables:
- Property Taxes: This is a big one in Texas. Don’t use generic estimates. Go directly to the Dallas Central Appraisal District (DCAD) or Tarrant Appraisal District (TAD) websites and look up the exact tax history for the property’s address.
- Homeowners Insurance: Get actual quotes for Dallas. Our premiums can be higher because of weather risks like hailstorms, so you need a real number.
- HOA Dues: These are incredibly common in Dallas suburbs and condo communities. It’s an expense that’s easy to overlook but can take a serious bite out of your cash flow.
Variable Expenses fluctuate, but you absolutely have to budget for them.
- Repairs & Maintenance: I tell my clients to start by budgeting 5-10% of the gross rent. An older home in East Dallas is going to need a much bigger maintenance fund than a new build out in Frisco.
- Property Management: If you’re not managing it yourself, expect to pay a pro anywhere from 8-10% of the collected monthly rent, which is the standard rate in DFW.
- Capital Expenditures (CapEx): These are the big-ticket items that pop up every few years—a new roof, an HVAC system, a water heater. Properly planning for future expenses with reserve funds is critical for your long-term financial health and prevents one major repair from sinking your investment.
Building an accurate expense profile is non-negotiable. Forgetting to include a $150 monthly HOA fee and underestimating Dallas property taxes by 1% can erase over $5,000 in projected annual cash flow on a $350,000 property.
When you meticulously detail every one of these income and expense items, your spreadsheet transforms from a simple calculator into a powerful tool. It allows you to analyze the unique financial landscape of any property in Dallas. To get an even better handle on the local market, check out our guide on the Dallas rental market trends and tips for more insights.
Calculating Your Key Investment Metrics

Alright, you’ve done the hard work of gathering all your income and expense numbers. Now for the fun part—turning that raw data into the metrics that truly matter for any real estate deal. These calculations are the beating heart of your rental property analysis spreadsheet. They’re what separate a good-on-paper deal from a genuinely profitable investment.
Let’s break down the exact formulas you need to plug into your spreadsheet. More importantly, we’ll talk about what these numbers actually mean for a property here in the Dallas market.
These aren’t just numbers for a spreadsheet; they’re the language of serious real estate investing. And understanding this language is more critical than ever, especially in DFW. Rising home prices are pushing more people to rent, creating a massive opportunity for investors who know their numbers. For a wider view, you can read about these global rental market trends and their drivers to see the bigger picture.
Net Operating Income and Cash Flow
First up is Net Operating Income (NOI). Think of this as the property’s pure, unadulterated profitability. It measures how much money a property makes from its operations before you factor in your personal loan details. This makes it a clean, simple indicator of the asset’s performance.
The formula couldn’t be simpler:
NOI = Gross Operating Income – Total Operating Expenses
Once you have your NOI, you can figure out the most important number for most investors: Cash Flow. This is the actual money left in your bank account after you’ve paid every single bill, including the mortgage. It’s the ultimate litmus test for a rental property’s month-to-month success.
The formula builds right on top of NOI:
Cash Flow = NOI – Debt Service (Mortgage Payment)
Positive cash flow means the property pays you. Negative cash flow means you pay the property. For almost every investor I work with in Dallas, strong, consistent positive cash flow is the name of the game.
Capitalization Rate
Next is the Capitalization Rate (Cap Rate), one of the most common metrics used to quickly compare different properties. It tells you the potential rate of return you’d get if you bought the property with all cash. This is a powerful way to compare an investment in McKinney to one in Mesquite because it takes financing out of the equation.
A “good” Cap Rate really depends on the specific neighborhood and your goals. In a hot, high-appreciation Dallas suburb like McKinney or Allen, an investor might be perfectly happy with a lower Cap Rate, say 5-6%. They’re banking on the property’s value skyrocketing. But in a cash-flow-focused area like Mesquite, that same investor would likely want a much higher Cap Rate—think 7-8% or more—for a better immediate return.
Here’s the formula:
Cap Rate = Net Operating Income (NOI) / Property Purchase Price
A higher Cap Rate can signal higher returns, but it might also come with more risk. A lower Cap Rate often means lower risk or a property in a market with strong appreciation potential.
Cash-on-Cash Return
Finally, we arrive at what I consider the most important metric for anyone using a loan: the Cash-on-Cash Return. This calculation tells you exactly how hard your actual invested cash is working for you. It measures your annual return based on every dollar you’ve pulled out of your own pocket—your down payment, closing costs, and initial rehab budget.
Here’s how you get to it:
- First, add up your Total Cash Invested (Down Payment + Closing Costs + Rehab Costs).
- Next, calculate your Annual Cash Flow (just multiply your Monthly Cash Flow by 12).
- Then, simply divide your annual cash flow by the total cash you put in.
Cash-on-Cash Return = Annual Cash Flow / Total Cash Invested
This percentage gives you a crystal-clear view of your return on investment. Many Dallas investors shoot for a target of 8% to 12%, but your personal goal will depend on your strategy. Once you have these formulas built into your spreadsheet, you can analyze deals in minutes and see instantly if a property is worth a closer look.
Using Advanced Analysis For Smarter Decisions

Alright, let’s take your rental property analysis spreadsheet from a simple calculator and turn it into a serious forecasting tool. While basic metrics give you a snapshot of a deal today, advanced analysis is what helps you see a property’s performance over its entire life. This is how savvy investors move from just buying properties to building a high-performing Dallas portfolio.
The real magic happens when you build out 10-year projections that account for the inevitable changes over time. I’m talking about modeling annual rent increases, estimating property value appreciation, and tracking your loan amortization. This allows you to see exactly how your equity builds and cash flow improves year after year.
This forward-looking approach is critical, especially now. In a hot market like Dallas where single-occupant rentals are in high demand, projecting future rent growth isn’t just a fun exercise—it’s essential for your success.
Creating A Dynamic Investment Dashboard
One of the most powerful—and surprisingly easy—upgrades you can make is applying conditional formatting in your spreadsheet. This simple feature automatically flags deals based on criteria you set. For instance, you can create a rule that turns any Cash-on-Cash Return over 8% bright green, or any property with negative cash flow red. It’s a simple visual cue that helps you spot the winners in an instant.
For investors juggling multiple opportunities across Dallas, creating a master dashboard is a total game-changer. This is a central tab that pulls the most important metrics from each individual property’s analysis sheet, letting you do quick, side-by-side comparisons.
Imagine you’re comparing three properties: one in Uptown, one in Lakewood, and another in Preston Hollow. A dashboard lets you see the Cap Rate, Cash Flow, and projected 10-year ROI for all three on a single screen. This high-level view lets you make decisions with speed and confidence.
This method is crucial for investors who want to pinpoint top Dallas neighborhoods for high ROI without getting lost in a dozen different spreadsheets. It streamlines your entire process, which is a massive advantage in a competitive market like this.
And for those of you who get bogged down manually entering data from bank statements or other documents to verify expenses, understanding how OCR is used for image to spreadsheet conversions can be a huge time-saver. It helps you populate your analysis template much faster, ensuring your numbers are accurate and current. When you combine long-term projections with a dynamic dashboard, your spreadsheet becomes your most valuable strategic asset.
Common Questions for Dallas Property Analysis
When you start digging into a rental property analysis spreadsheet for a potential Dallas investment, the same questions almost always surface. Trust me, getting clear, Dallas-specific answers to these is the key to building a financial picture you can actually rely on and avoiding some serious headaches later.
Let’s walk through some of the most frequent questions I hear from investors trying to make sense of the DFW market.
How Do I Accurately Estimate Property Taxes in Dallas?
To get a precise estimate for Dallas property taxes, your first stop should be the Dallas Central Appraisal District (DCAD) website. Look up the property there to find its official appraised value. From there, you’ll need the combined tax rate for that specific address, which bundles together taxes for the county, Dallas ISD, the city, and any other local entities.
For a quick, back-of-the-napkin calculation when you’re first looking at a deal, many Dallas investors will pencil in a rate of 2.5% to 3.0% of the purchase price. But you absolutely must verify the exact rate with DCAD for your final numbers. This is one of your biggest expenses, and getting it wrong can sink your cash flow.
What Is a Realistic Vacancy Rate for a Dallas Rental?
I always advise my clients to be conservative here. A safe vacancy rate to plug into your spreadsheet is between 5% and 8% of your Gross Scheduled Income. If you’re looking at a hot neighborhood like Uptown or a property near one of the big corporate campuses in Plano, you might feel comfortable leaning closer to 5%.
On the flip side, for an older property or one in a less competitive submarket, using 8% to 10% is much smarter. It gives you a realistic financial buffer for those inevitable gaps between tenants.
Can This Spreadsheet Analyze Multi-Unit Properties?
Absolutely. Any well-built spreadsheet template should be flexible enough to handle multi-unit deals. Let’s say you’re analyzing a duplex in East Dallas. You would simply create separate line items in your income section for each unit’s rent. Then, just sum them up for your total income.
While your big-ticket expenses like property taxes and insurance will cover the entire building, don’t forget to scale your variable costs. Your budgets for maintenance and vacancy will naturally need to be higher to account for the added wear and tear and turnover risk that comes with managing multiple units.
Ready to stop guessing and start making data-driven decisions in the Dallas market? The expert team at Dustin Pitts Dallas Real Estate Agent LLC can guide you through every step, from detailed property analysis to closing the deal. We provide the local knowledge and professional insight you need to invest with confidence. Find your next Dallas investment property by visiting us at https://dustinpitts.com.